A fork of Haskell prometheus-client
For the last few months, I slowly work on improving the prometheus-client library. And I’d like to share some details of that work. Maybe it will be interesting for you or you can suggest some ideas or code.
What are the problems with the library? Prometheus is designed for simplicity and speed. In general, a developer should never think whether to add a new metric or not. It should be safe to add it (unless it has labels with very high cardinality). Unfortunately, Haskell library does not afford that. In the past, I’ve experienced severe speed degradations with metrics enabled and that lead to disabling them for an extended period. Today, we have carefully analysed the speed and slowly adding metrics one-by-one measuring performance and improving the library if needed. Besides, prometheus itself is not ideal for some kinds of metrics, but more on that later.
When doing changes, I’ve followed the following rules:
- metrics should not allocate (as long as it’s possible), there are a lot of allocations in Haskell programs anyway, but there is no reason to increase them especially when measuring anything in a tight loop
- Metrics should use atomic instructions and be non-blocking as much as possible, and run in in understandable blocks of time.
To solve that problem, I’ve introduced variants of counter and gauge for integral values. It’s a pity that you have to to use floating points in a place where only have only integer values. Prometheus documentation tells it’s ok, because you’ll not have rounding errors up to the very high amounts, and this way you may have the same structures for both integers and floats. It’s a valid point. Still it’s possible to experiment. If we take integers, then we can use atomic instructions fetchAddIntArray#, fetchSubIntArray#, atomicWriteIntArray# (or ones from atomic-primops package) and use them. The current implementation also uses CAS instructions, but it does it on the boxed values, so for each write to the storage, you allocate additional structures, with the current approach you should not. On basic experiments using a single thread, IntCounter and IntGauge give 10-20% speedup, and that implementation does not introduce additional allocations, so why not get the benefit for free? Interestingly, the go library claims the same performance as Int* approach, it’s done by packing floats in int and performing CAS operations on ints, looks a bit weird but it works.
But why such a small speedup matter? Evaluation time of the measured activity is usually a few magnitudes higher so, in any case, additional 20ns for an operation will be just statistical noise. That is true. But the situation starting to change when you look at the more advanced metric types, for example, a histogram is structured as a set of counter values as buckets, so for you should almost immediately get the next order of magnitude values.
But in general, those structures were just a first step and experiments.
The next changes are more engaging, lets take a look at some real case: we use concurrent logging mechanism, so each thread writes logs to the TBQueue and continues execution, background thread reads records from the queue and dumps those to the handle. The queue is bounded, so if there will be too many entries generated threads blocks on write. We have two parameters to configure:
- size of the queue
- how many values background thread may read from the queue in a time
But how to configure those parameters and how to measure if everything is going ok with the process? The usual solution is to add the following metrics:
- integer counter for the number of written logs.
- (in our case) integer counter for the number of records written to the output
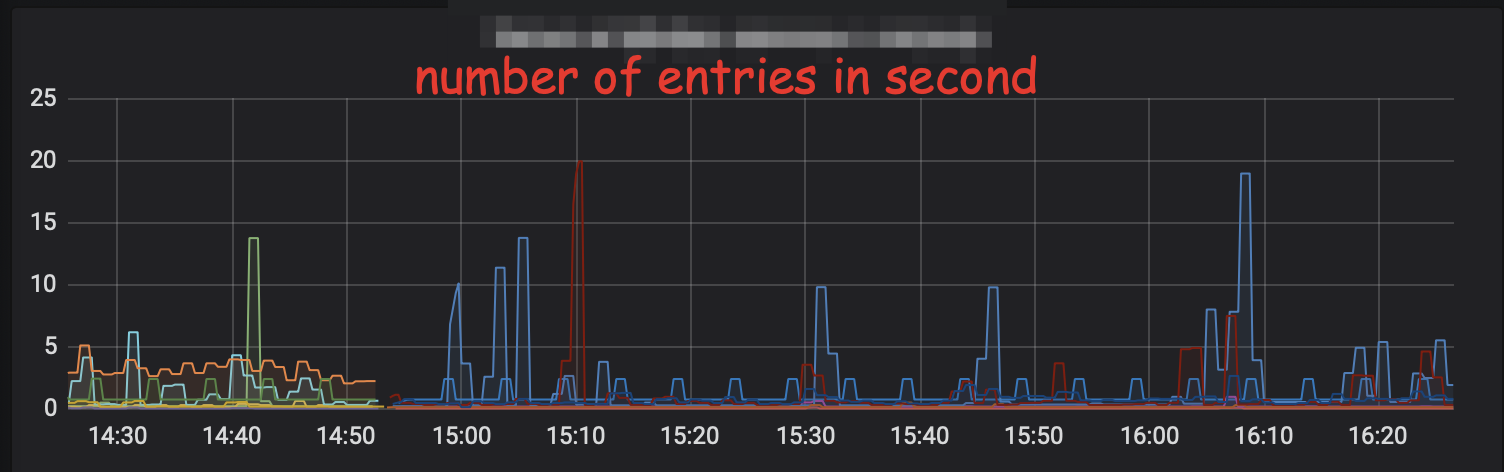
Based on those values, you may configure several graphs and alters, the rate of messages, the number of records in the queue. For the first value, you may get an excellent plot, but for the difference, you a line of zeros, unless something goes off. It happens because the logs are scraped in infrequently, in our case, it’s one minute, and all the values normalise in that time. So with such metrics, you can get alerting, but you don’t have insight on how exactly the system operates, and can’t use that to tune parameters. But what to do? One answer is to scrape logs more often, but that will incur high costs on the measurements tracking system and applications.
To solve that tried the following decision, it’s highly experimental but already works in our production. We measure number in-flight messages as a gauge, but in addition to the current value that gauge stores maximum value in a window. The question is how to define a window, and I don’t want to track time. Hence, the window is any time between two scrapes, it’s semi optimal solution as now observer affects the system and analytical system may no longer get some values. But this approach works, and instead of a line of zeros, you may get a beautiful plot:
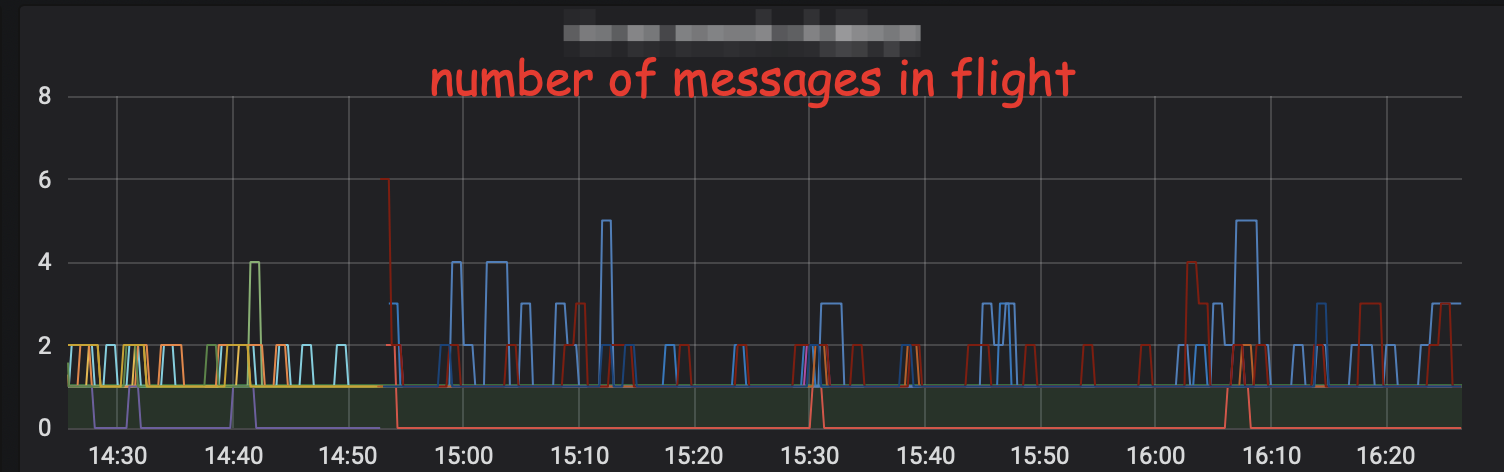
There are some problems with that approach: it’s not evident how to generalise this solution, so it handles other functions, not just maximum. Will be easy to handle floating points as well.
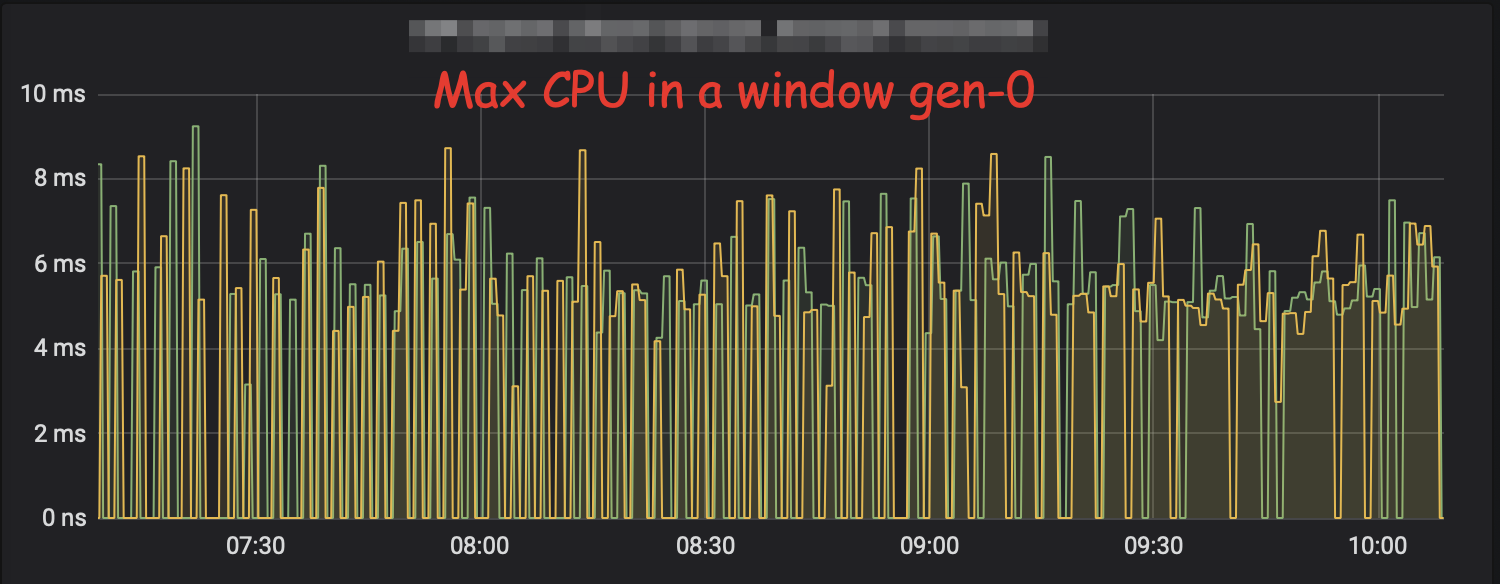
But that is not all I’m also using the prometheus-client-ghc package, some time ago I had a post about it. There is a problem with that package is that it reads metrics only when it’s asked by the scraper, so as a result it has total and information about the last GC. So you can calculate totals, averages and random data. It’s not so good. To solve that I’ve completely rewritten the package now it works in the following way:
- it sets up a GC hook that is called after each GC, so you no longer lose information about any GC
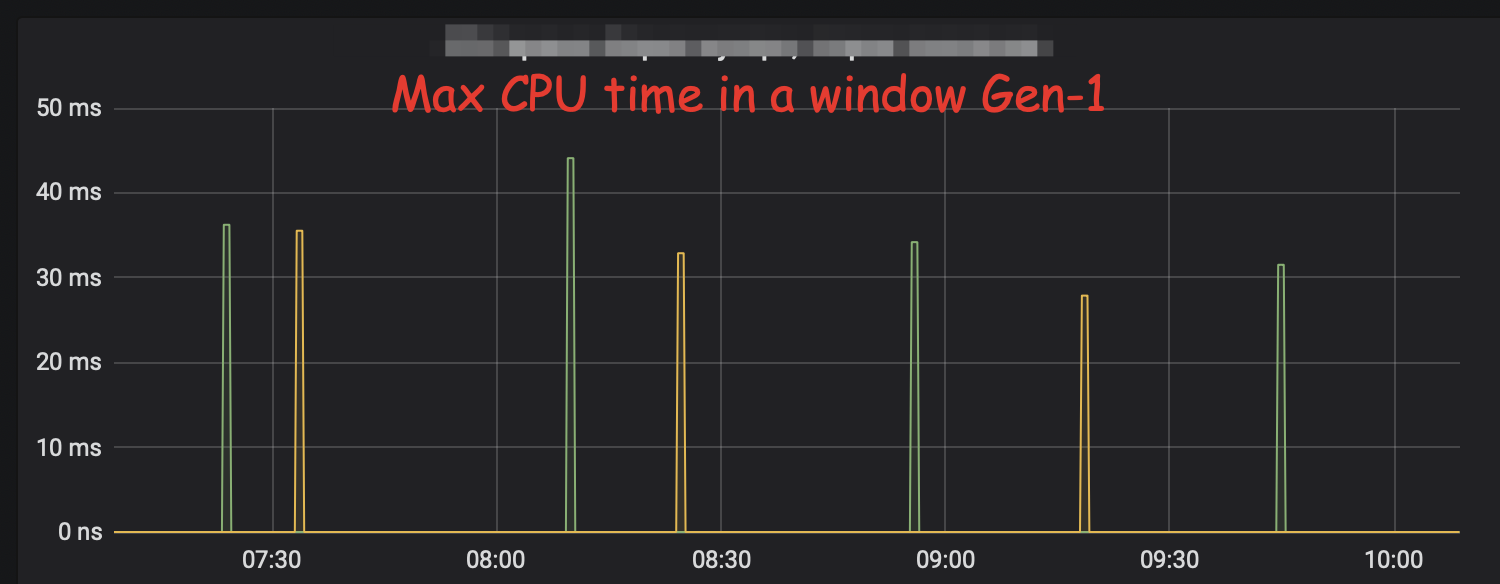
- It splits information about each GC generation so you can analyse that separately
- In C code we calculate all the values, with the rapidly changing values we follow the same window approach as above, so we never lose unexpectedly long GC (that will be hidden if you show rate or average)
- Everything is appropriately (I hope) documented
All of that functionality is battle-tested on our services and behaves quite well.
It’s still not ideal as it handles only two gc generations instead of any, it does not calculate histograms, but only maximum values.
For the library, I have the following plans, introduce all experimental metrics like window gauge that my project needs (as this point, I see the use in a floating window gauge). After that, I’d like to go to the core library and apply the same approach to the histograms and later to the way labels managed. After that, I’m going to experiment with a way logs are exported, I expect that it’s very suboptimal and we can win a lot by a slightly different approach, but I don’t yet have evidence here. After that, I’d hope to add HDR histograms support, as the current approach renders them unusable for many cases, but that is a topic for another post.
Why I’m using separate repo and has not opened any PR? The main reason is that I plan to change almost entire implementation and I’m not sure that current maintainers will be happy about all the changes. Unfortunately, I need all the changes I did yesterday or in the worst case tomorrow in production, so I’ve decided to work without cooperating with upstream and save some time for me. Maybe I’m wrong, but I’m open to suggestion.
comments powered by Disqus