In the last post, I’ve talked about adding metrics to a Haskell application. Unfortunately that post didn’t have a full code example and contained only minor pieces of the code. So it could be hard to write your own application based on that post. So I decided to prepare a full example that can be looked at and reused in later posts and projects. You can find the source code on GitHub. The app is a very simple skeleton so if you have experience with writing those feel free to skip this post.
I’ll take the techempower benchmark as a site specification. The API is simple enough to represent exciting features and doesn’t take much time to write. I’m not going to compete against other implementations of that benchmark (at least I think so at the time of writing this post). Today I’m going to make a skeleton of the site and one endpoint only.
I’ll take servant as a web framework, to my taste it is the best framework you can use unless you have exceptional needs. The main feature of the servant framework is that it allows to generate and test much code for free, without much extra cost.
Servant framework has a very nice tutorial and documentation that can be found at read-the-doc site .
When writing an application using servant you first need to define its API:
type Api
  = JsonApi

type JsonApi
  = Description
    "Raw JSON output API \
    \ For each request, an object mapping the key message \
    \ to \"Hello, World!\" must be instantiated."
  :> "json"
  :> Get '[JSON] Message
I prefer to keep a type synonym for each endpoint (or endpoint structure) as that would allow using that type in the other parts of the program for code generation.
This type explains how a handler does its work and :> splits the type into URL pieces. This type tells that application can handle Get requests to the URL /json if accept type is application/json and when doing that it returns a Message.
The additional Description part comes from the servant-swagger package. A few more extra lines provide additional information about our API:
apiVersion :: T.Text
apiVersion = "0.0.1"

swagger :: Swagger
swagger = toSwagger (Proxy @ Api)
  & info.title .~ "Experimental API"
  & info.description ?~
    "This is a benchmark site, and used for general \
    \ experiments and blog examples."
  & info.version .~ apiVersion
Now we can run the server. Our sever consists of the swagger UI and our application.
type API
  = SwaggerSchemaUI "swagger-ui" "swagger.json"
  :<|> Api

run :: IO ()
run = do
  Warp.run configPort
    $ prometheus def {
        prometheusInstrumentPrometheus = False
        }
    $ serve (Proxy @API)
    $ swaggerSchemaUIServer swagger
        :<|> server
  where
    configPort :: Int
    configPort = 8080

server :: Handler Message
server = pure $ Message "Hello World!"
Remember prometheus def lines from the previous post. And the application runner is:
import Prometheus
import Prometheus.Metric.GHC
import Sample.Server (run)

main :: IO ()
main = do
  _ <- register ghcMetrics
  run
Now we can have an application that returns us {message:"Hello, World!"} on json URL and swagger UI on swagger-ui/. With that interface you can explore site API:
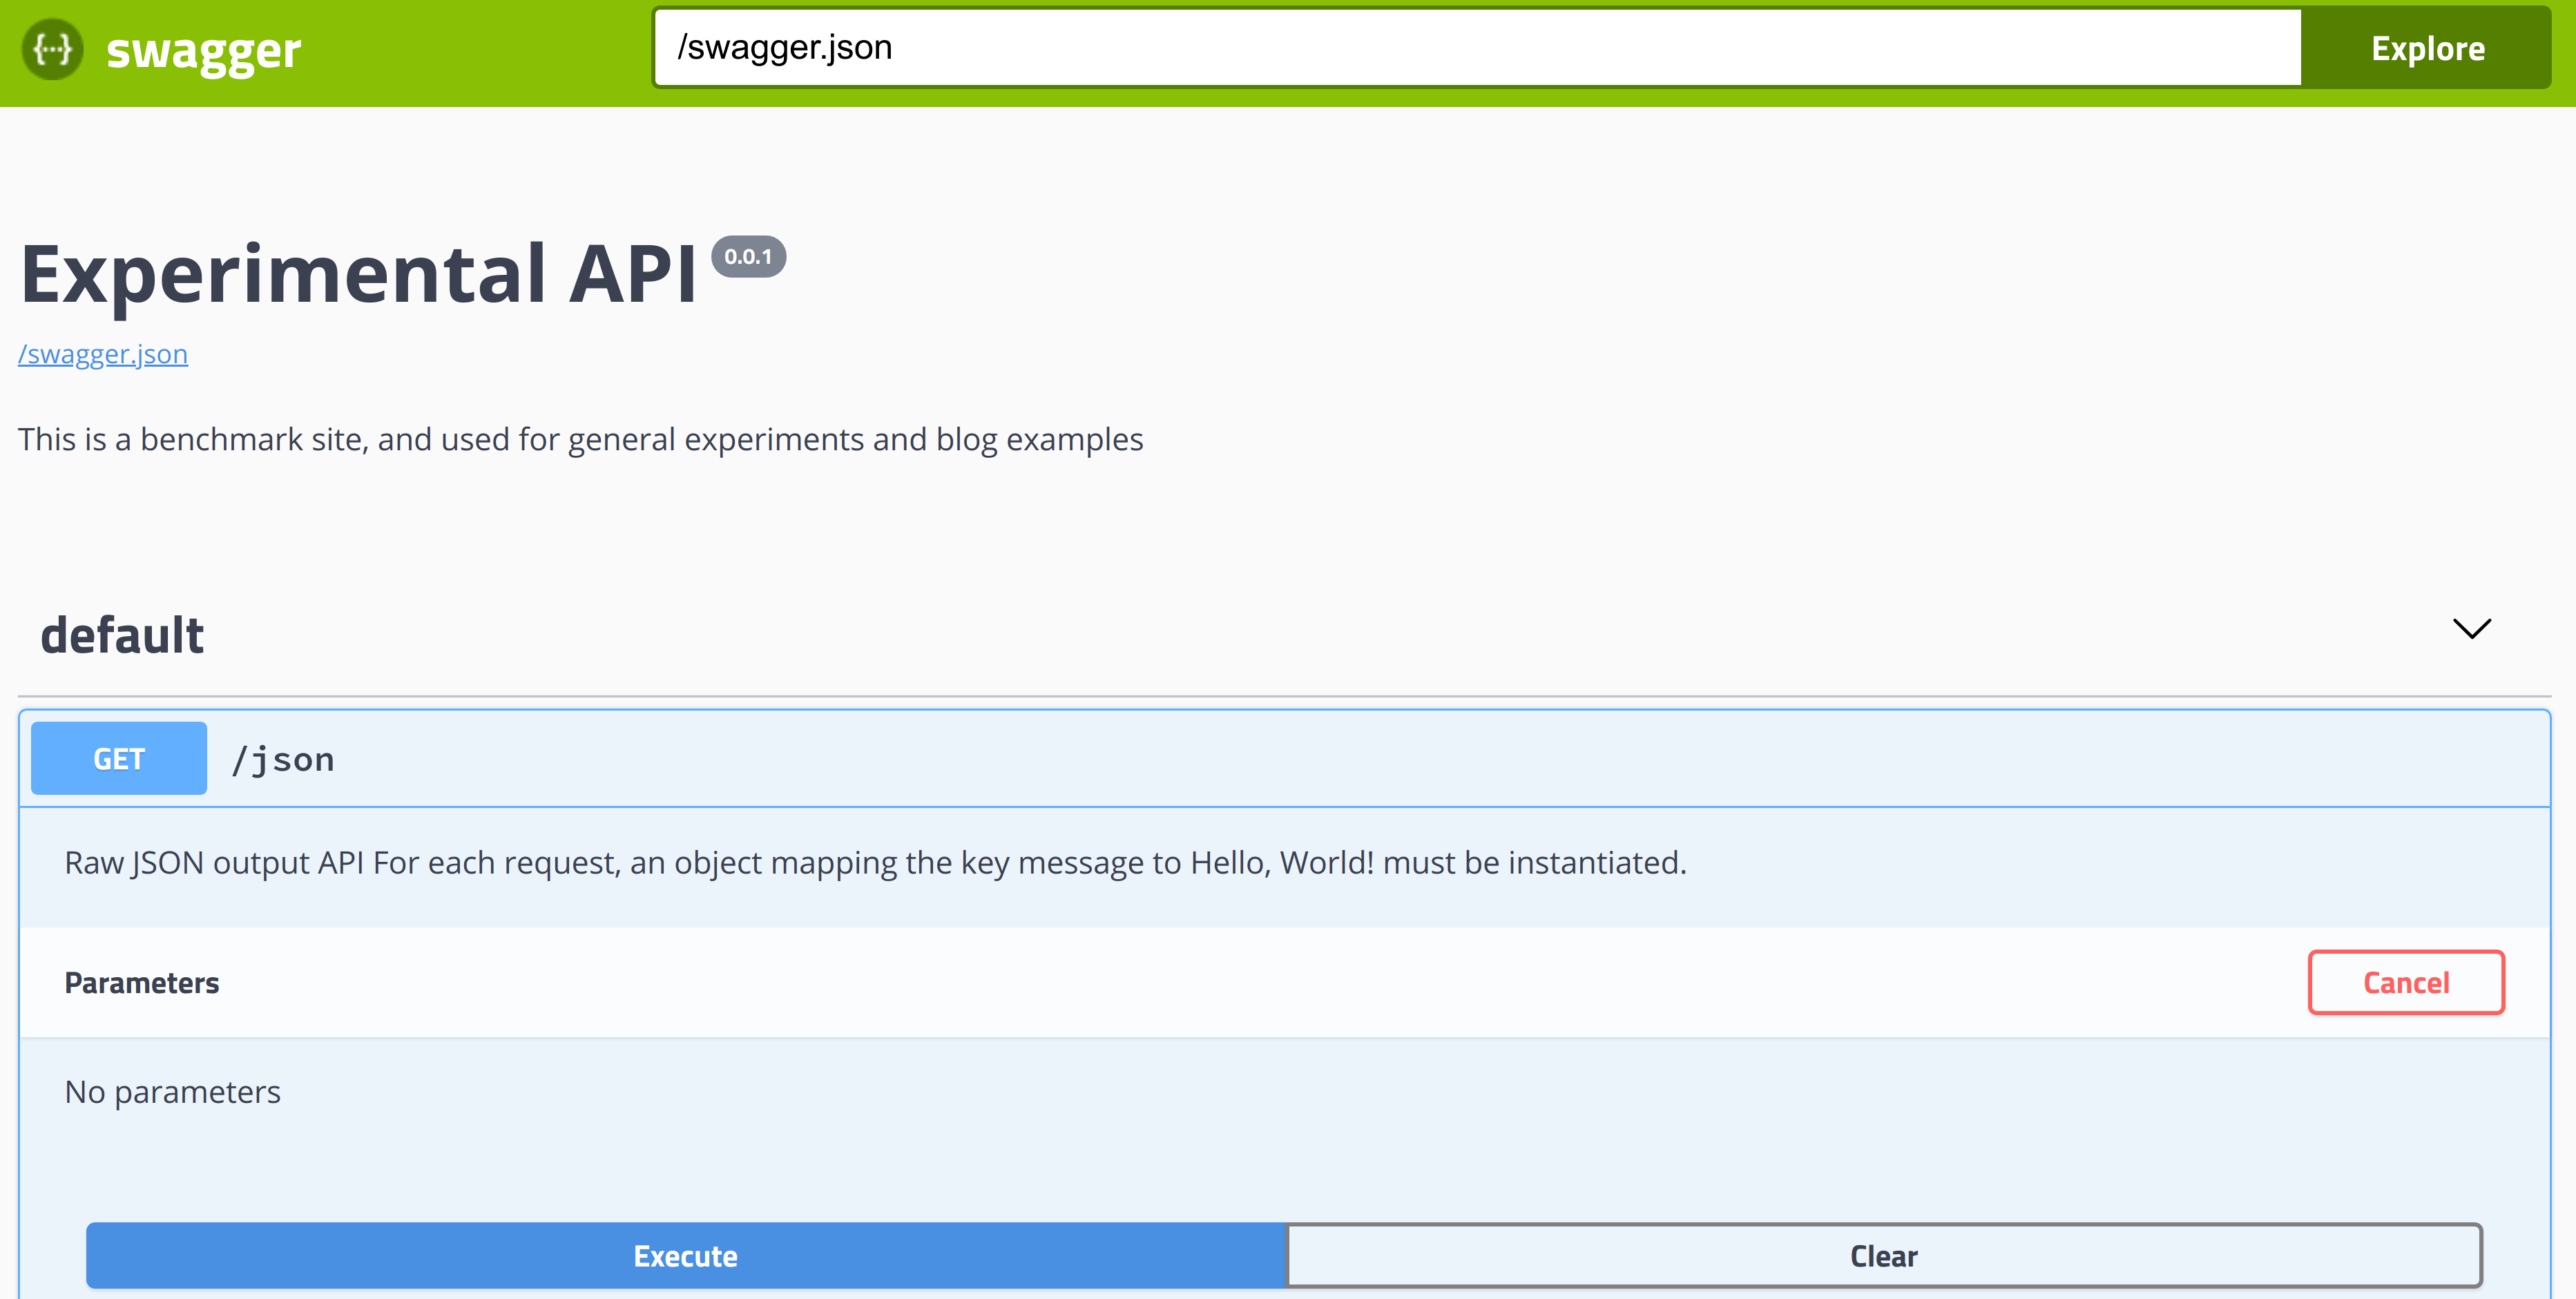
Send requests and observe results
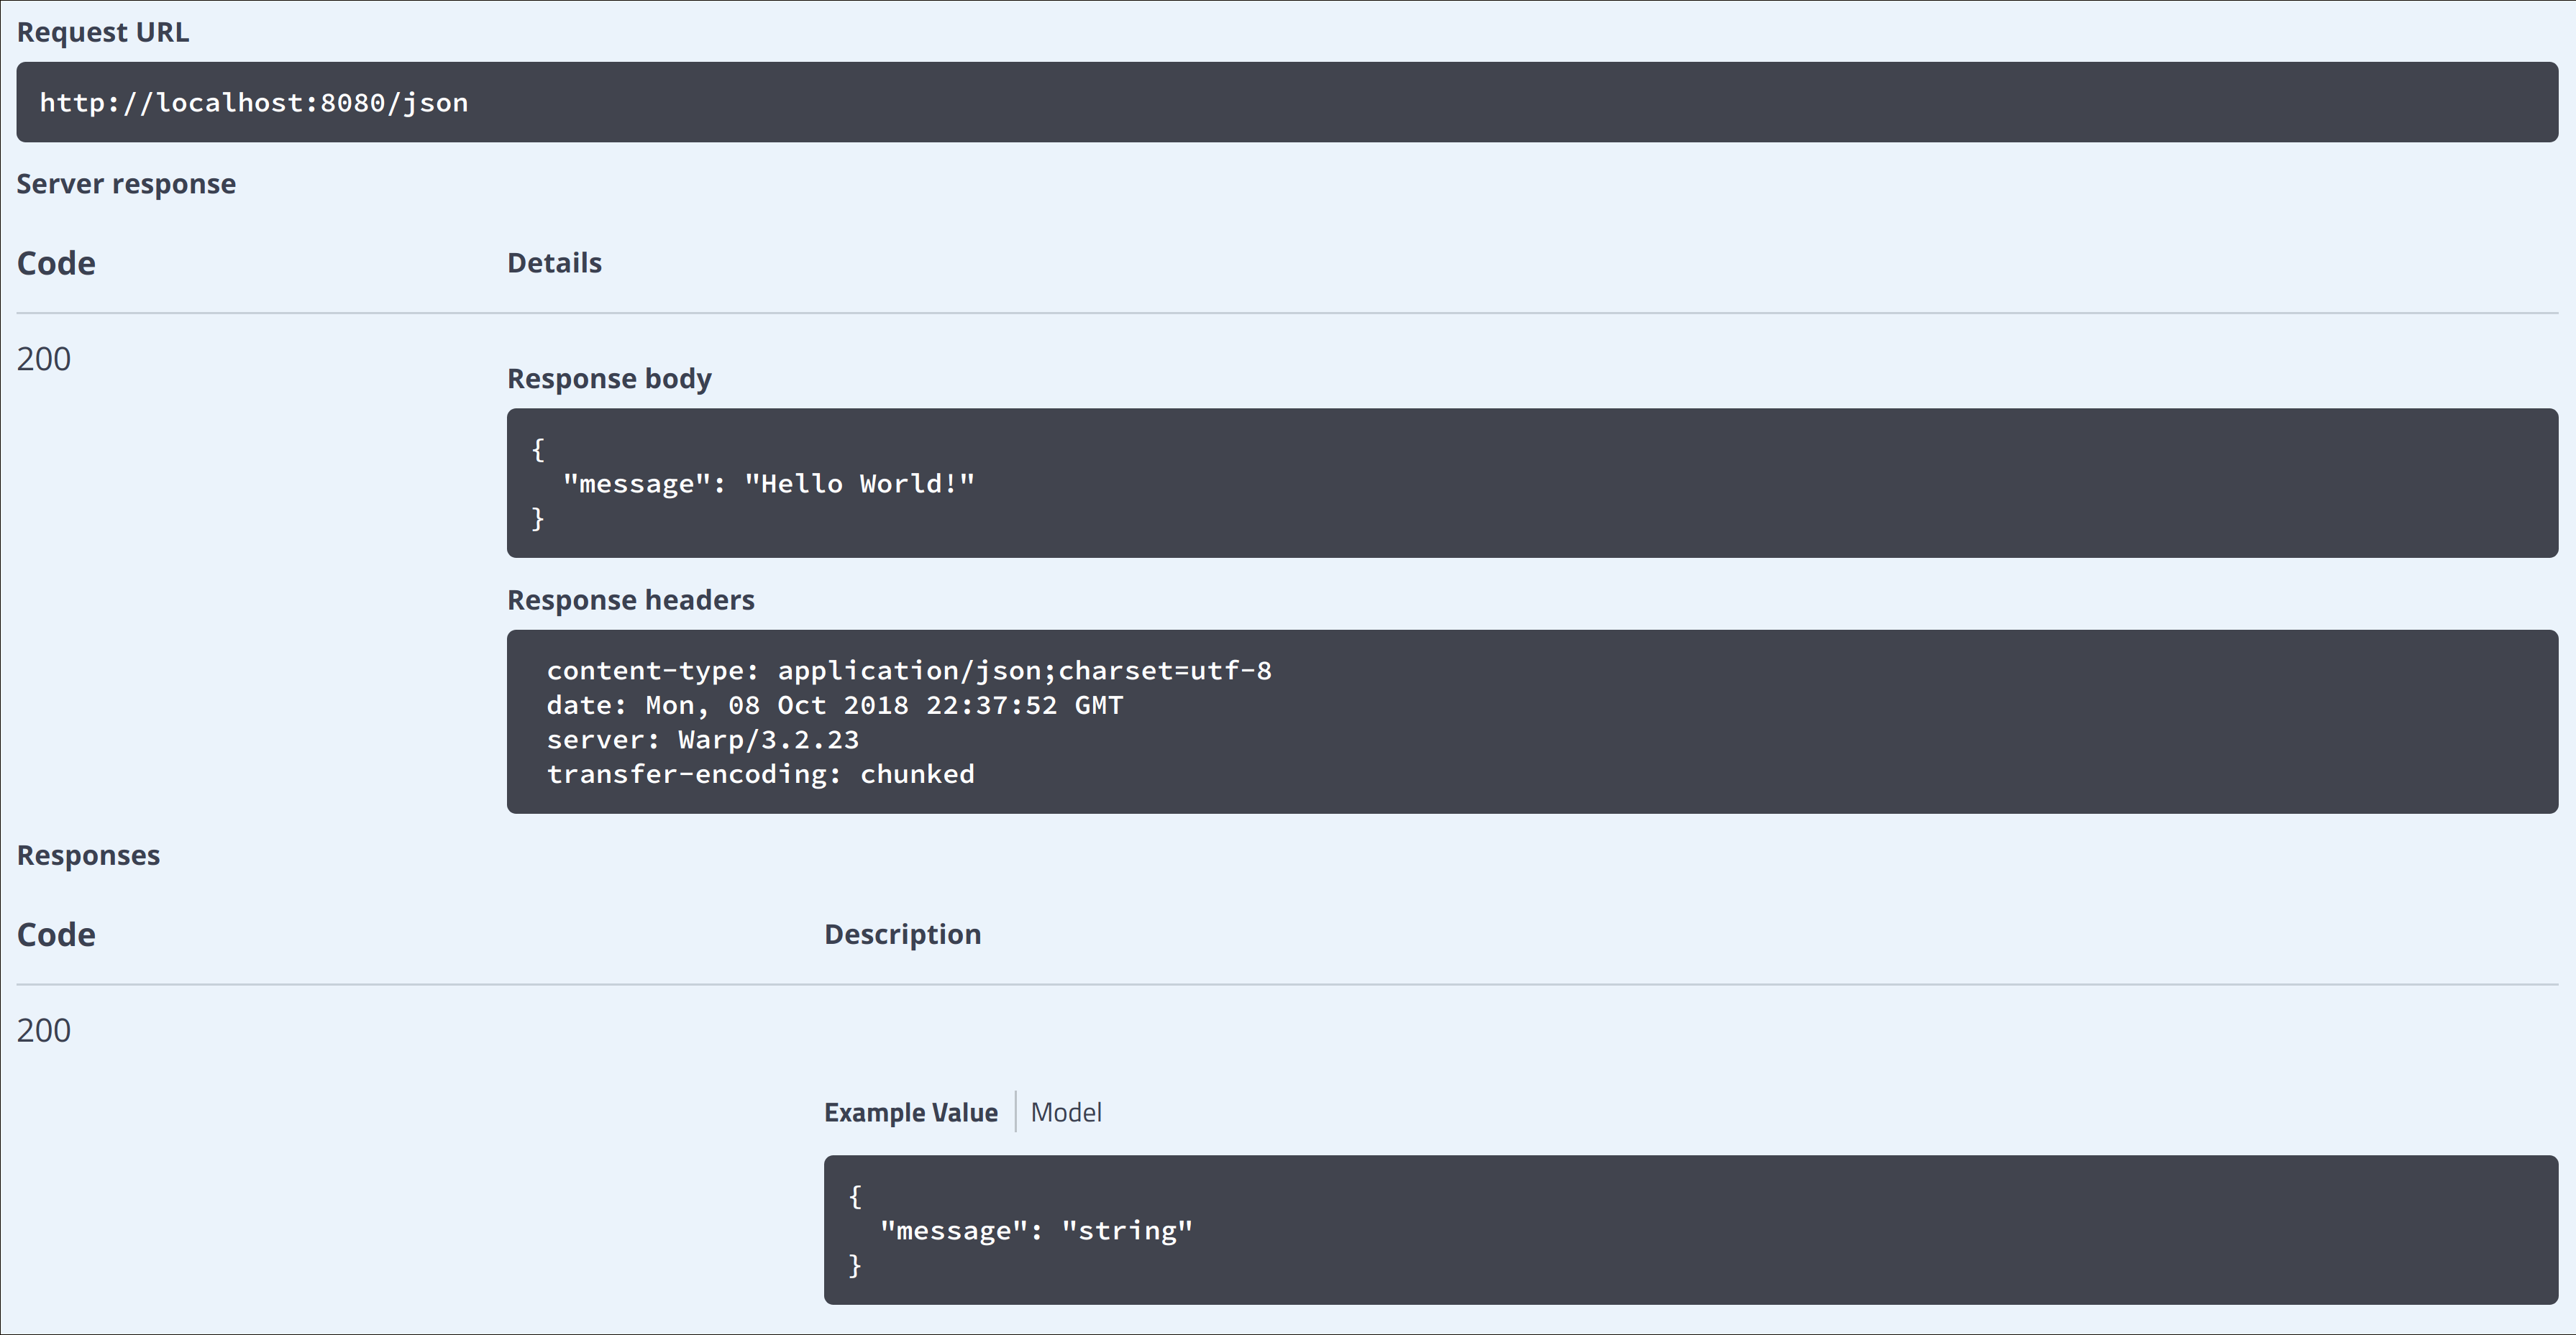
And all that comes for free.
There are a few more things I’d like to discuss before moving to metrics:
Naming conventions - it’s worth to define common conventions for converting Haskell data types into their JSON representation and use them across the project.
Encoding tests with servant and swagger you can automatically test serialisation of values for all the types used in the API. Also tests check that specification is up to date.
Now we have a simple site with helper interface and specification. There are many missing pieces, for example: a. configuration parsing; b. logging; c. more autogenerated tests; d. nice defaults for RTS options.
All of them will be covered in the following posts.
In order to build everything I prefer to use nix package manager. Both stack and cabal-install are nice tools to do that but with nix you can add more features to the build system. For example building of docker containers, building packages written in other languages and setting up a development environment. Build scripts for the package can be found at overlays.nix. Build scripts for its docker container are in docker.nix.
At this point we are ready to setup our environment with Grafana and Prometheus. Configs are the same as the ones described earlier or they can be found at GitHub.
Graphana reports are looking like:
- Main screen:
main screen lists all instances with Haskell application to filter on. If specific instance is chosen then all the following plots show information for that instance only.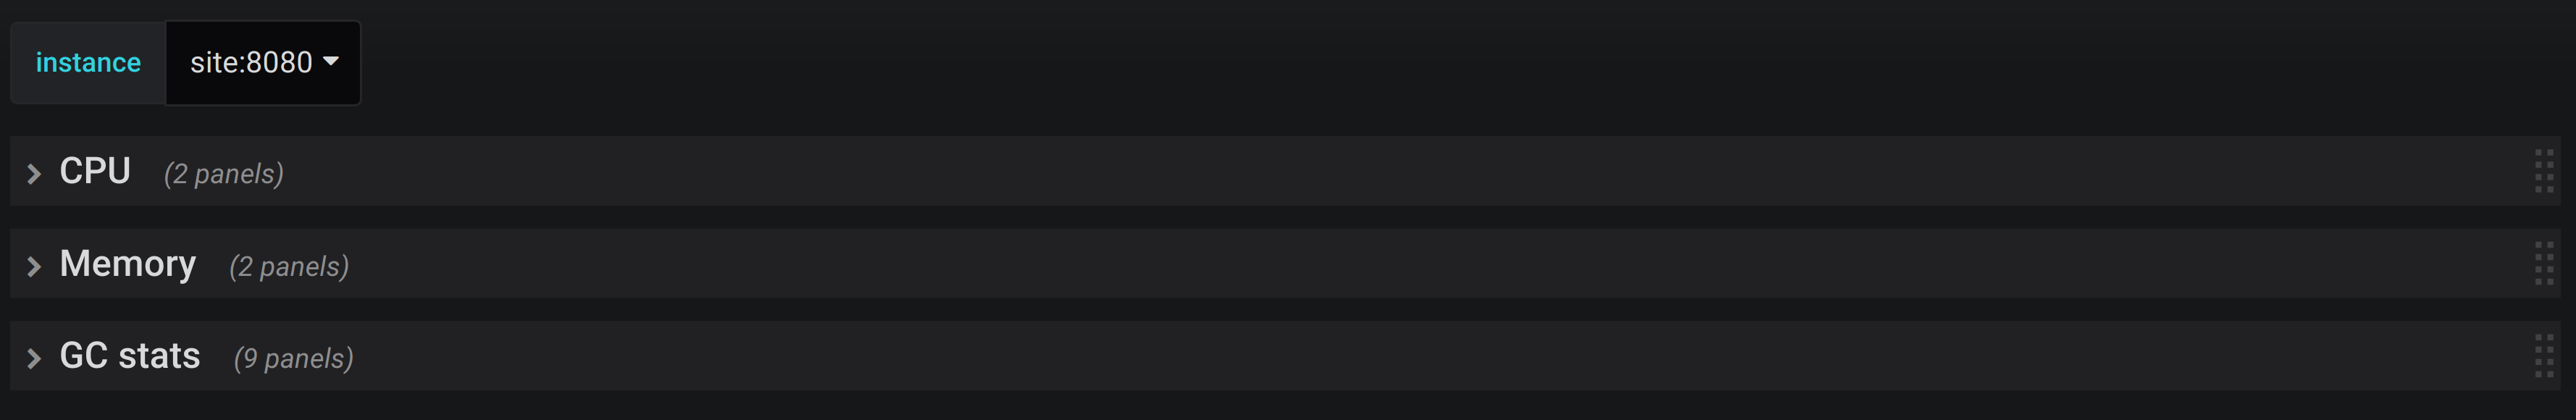
- CPU panel:
shows rate of CPU seconds spent by the program. Basically it says whaf fraction of a secod the program worked during 1s of clock time. You can realize how active your application was.Mutator CPU timeshows how much CPU time you’ve spent doing actual work. If total CPU time is much higher than Mutator CPU time, then you are likely to have problems with GC.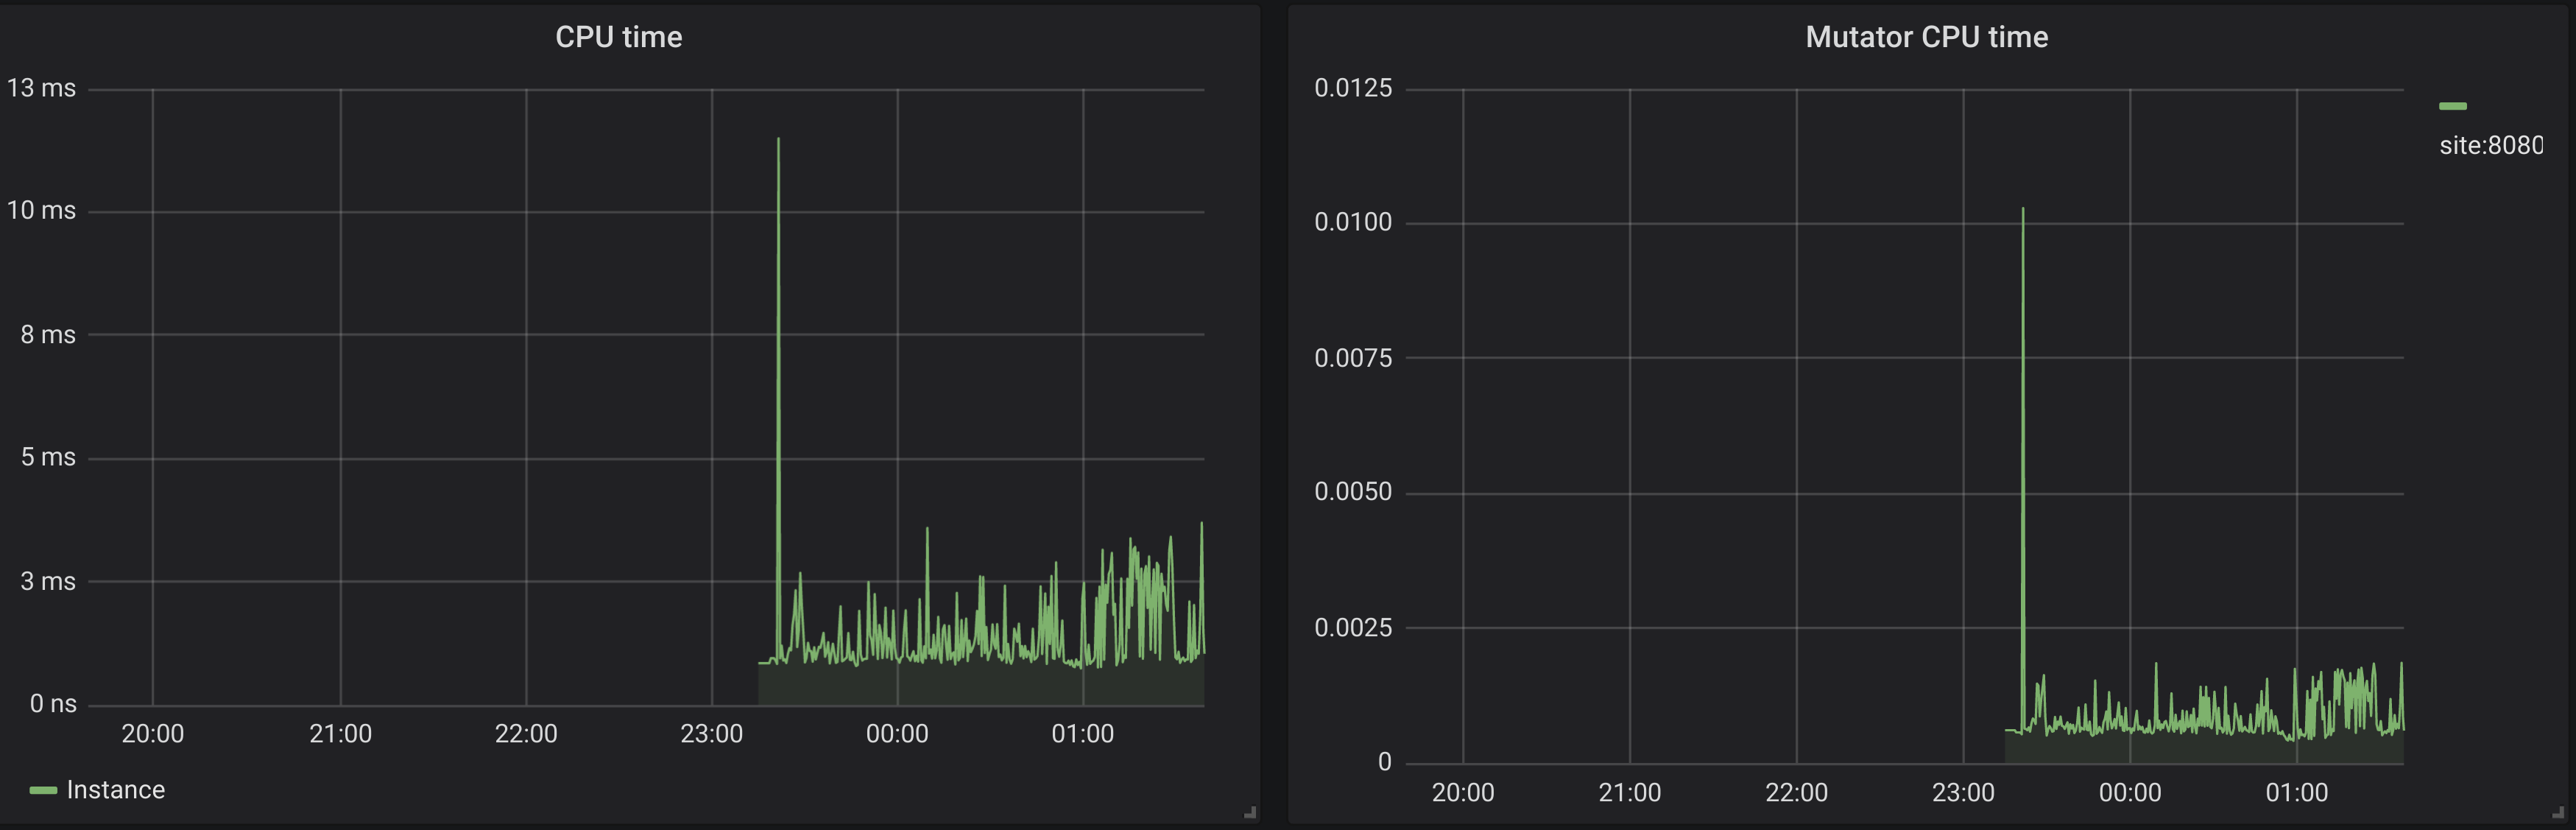
- Memory panel:
shows the rate of allocations and copying data during GC. This panel is for general information because it’s not easier to use other controller to get information about memory usage of the given instance.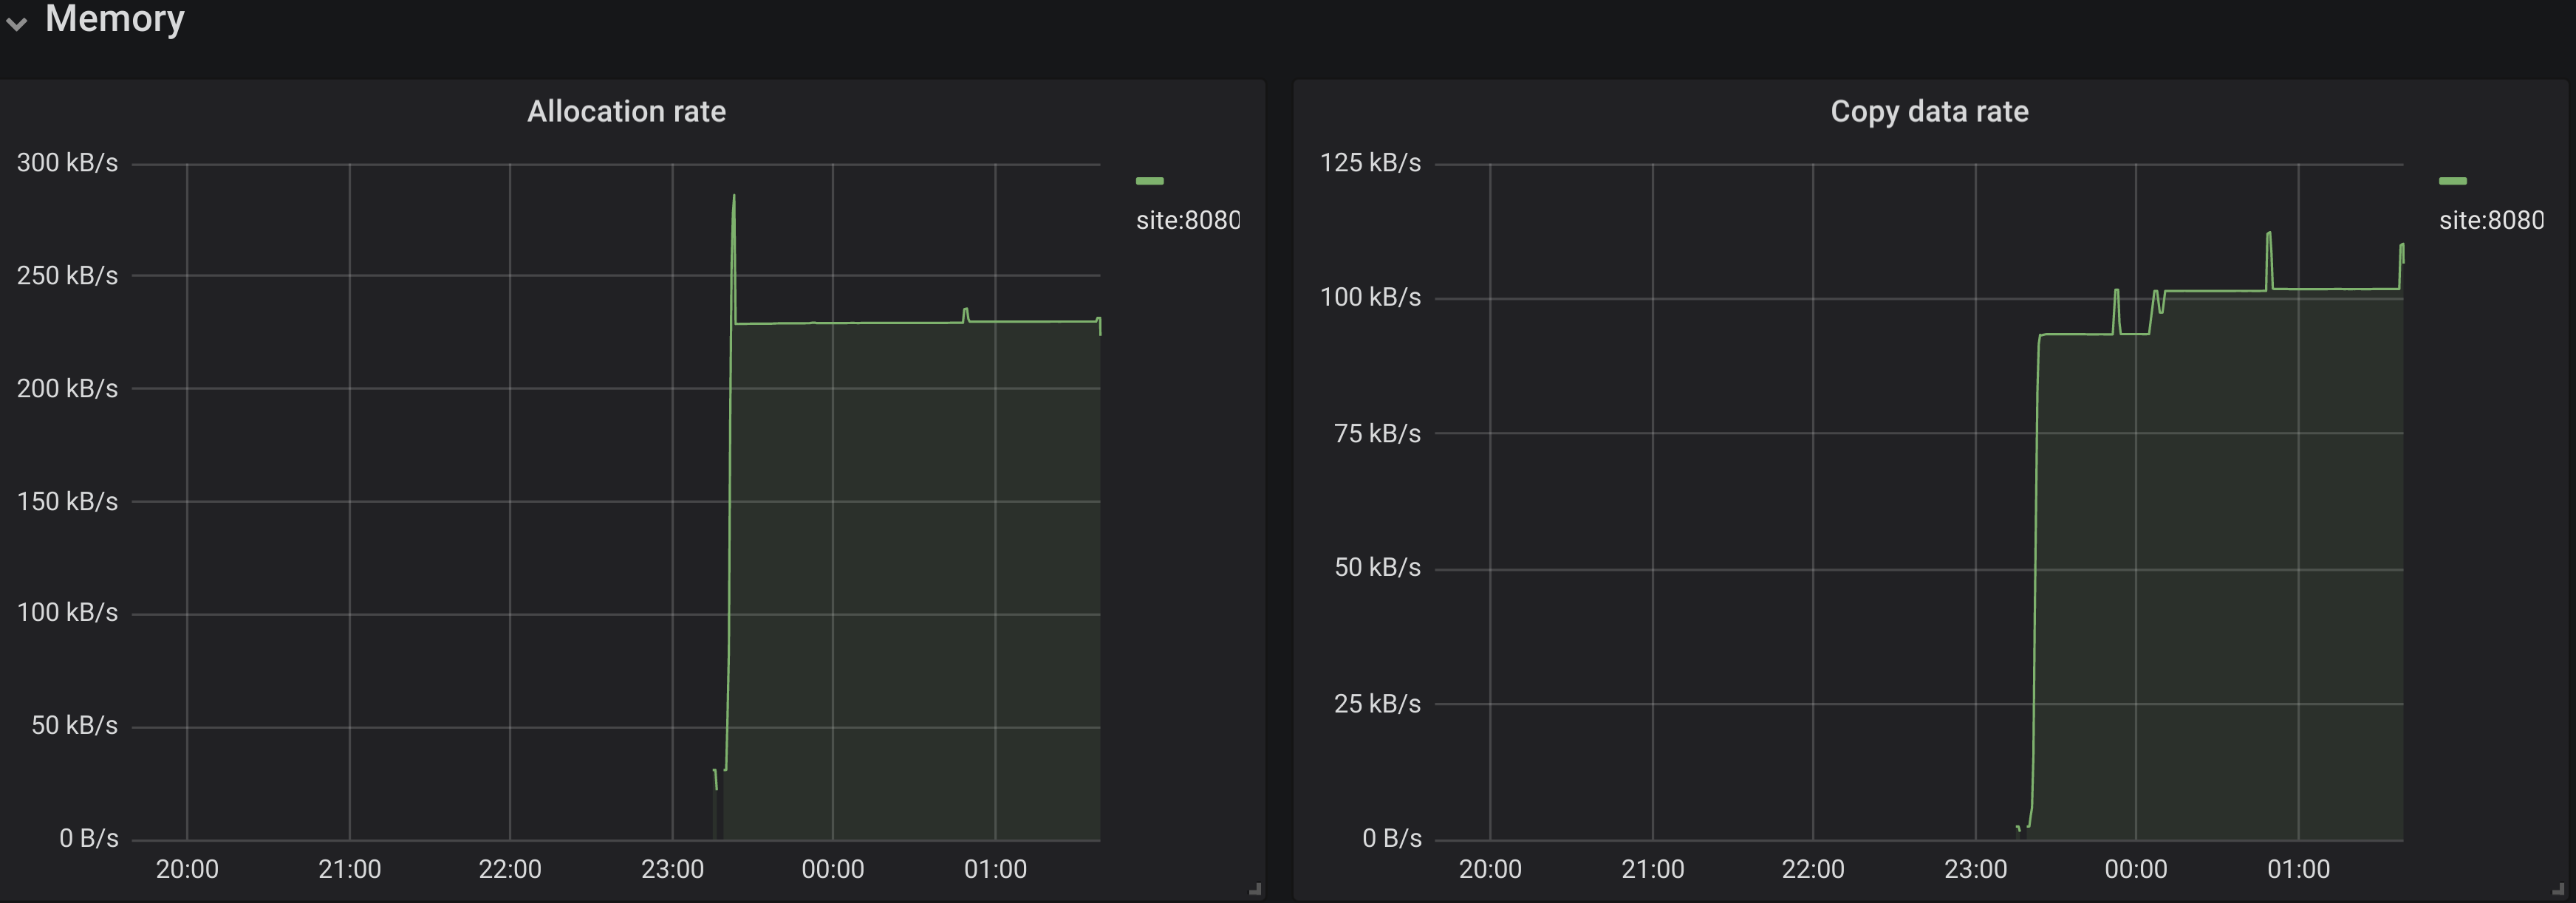
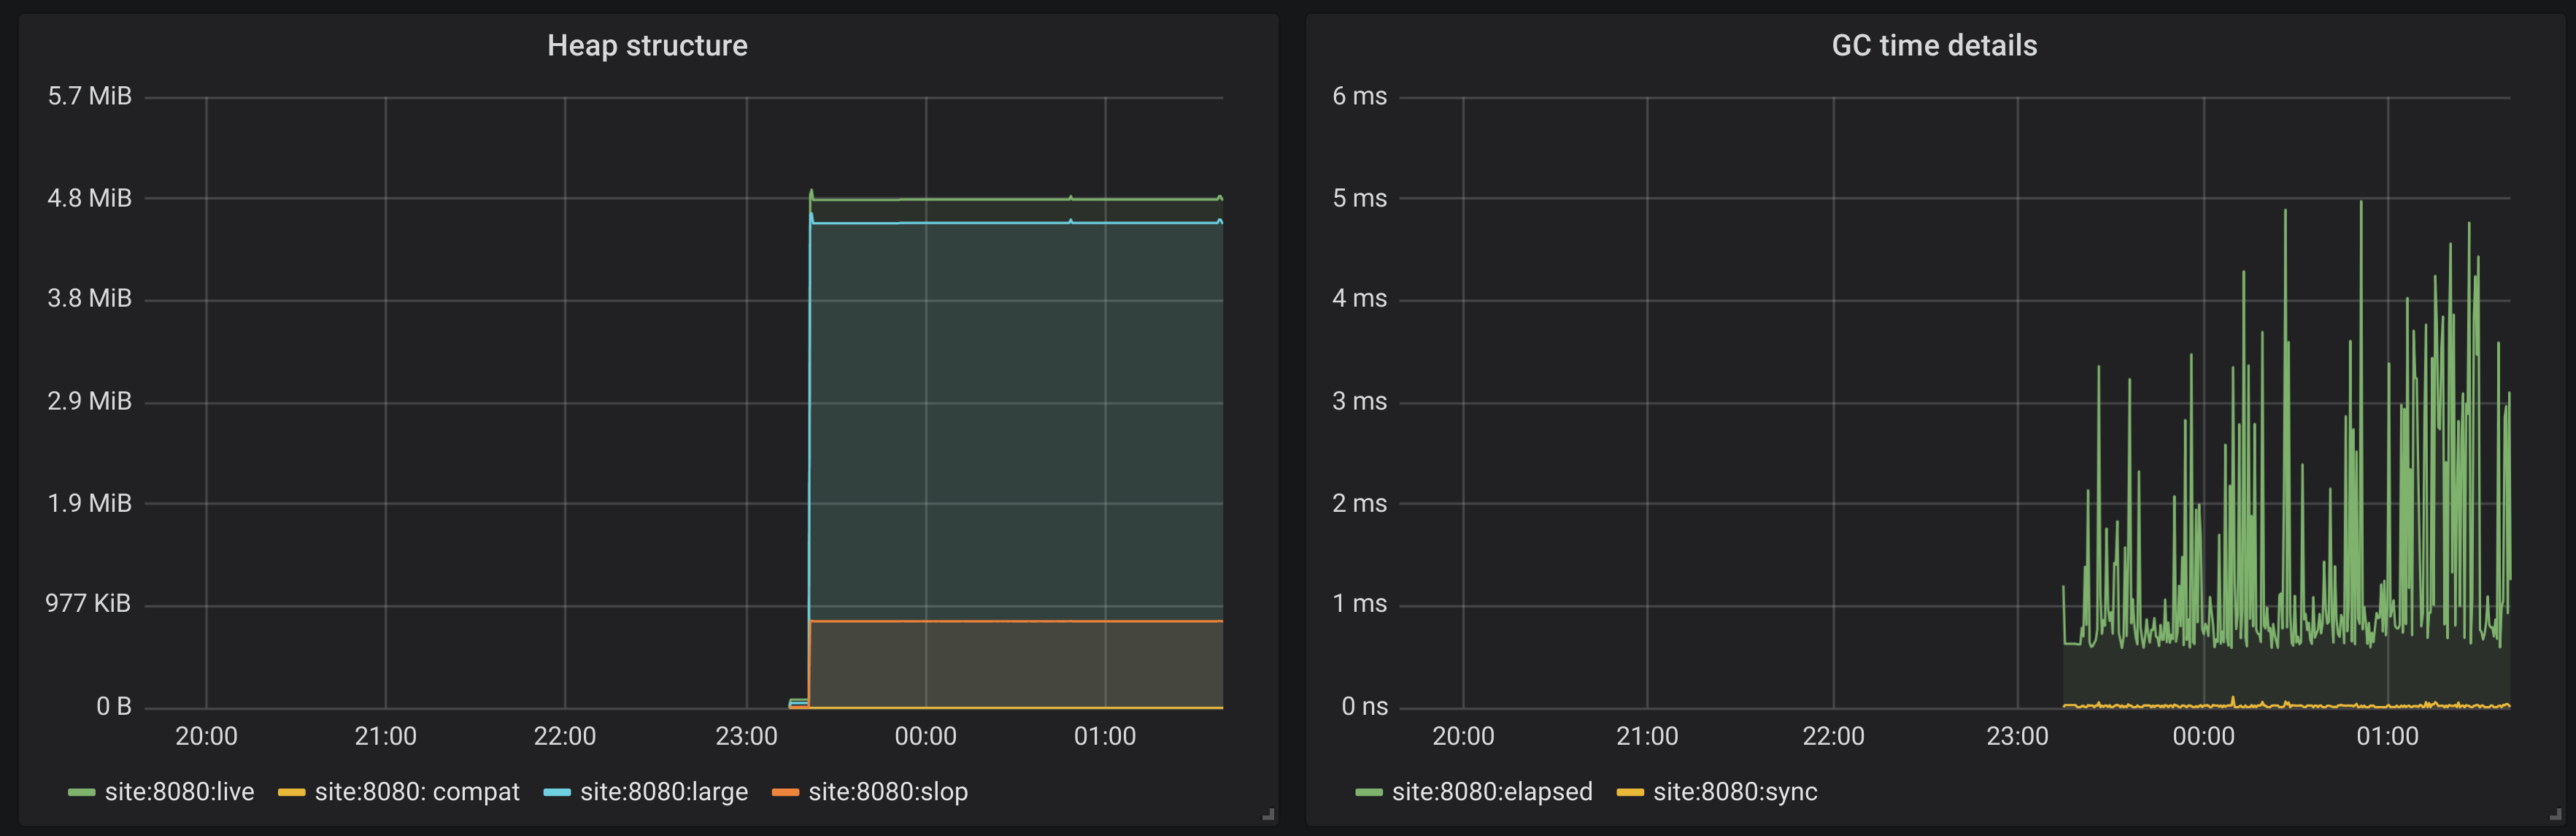
- GC information:
data that shows GC information that is provided by the runtime system. It provides total number of GCs and major GCs and their rate. Proportion of time spent in GC to the total running time, if this metric grows higher than 0.1 then it means that you are spending one tenth of your time in GCs and that is not good. Proportion of the time that capabilities spent synchronising to the time they did actual work, if this value grows high then you have problems.In addition the structure of the heap is explained and we plot how many values of different types (from GC perspective) we have.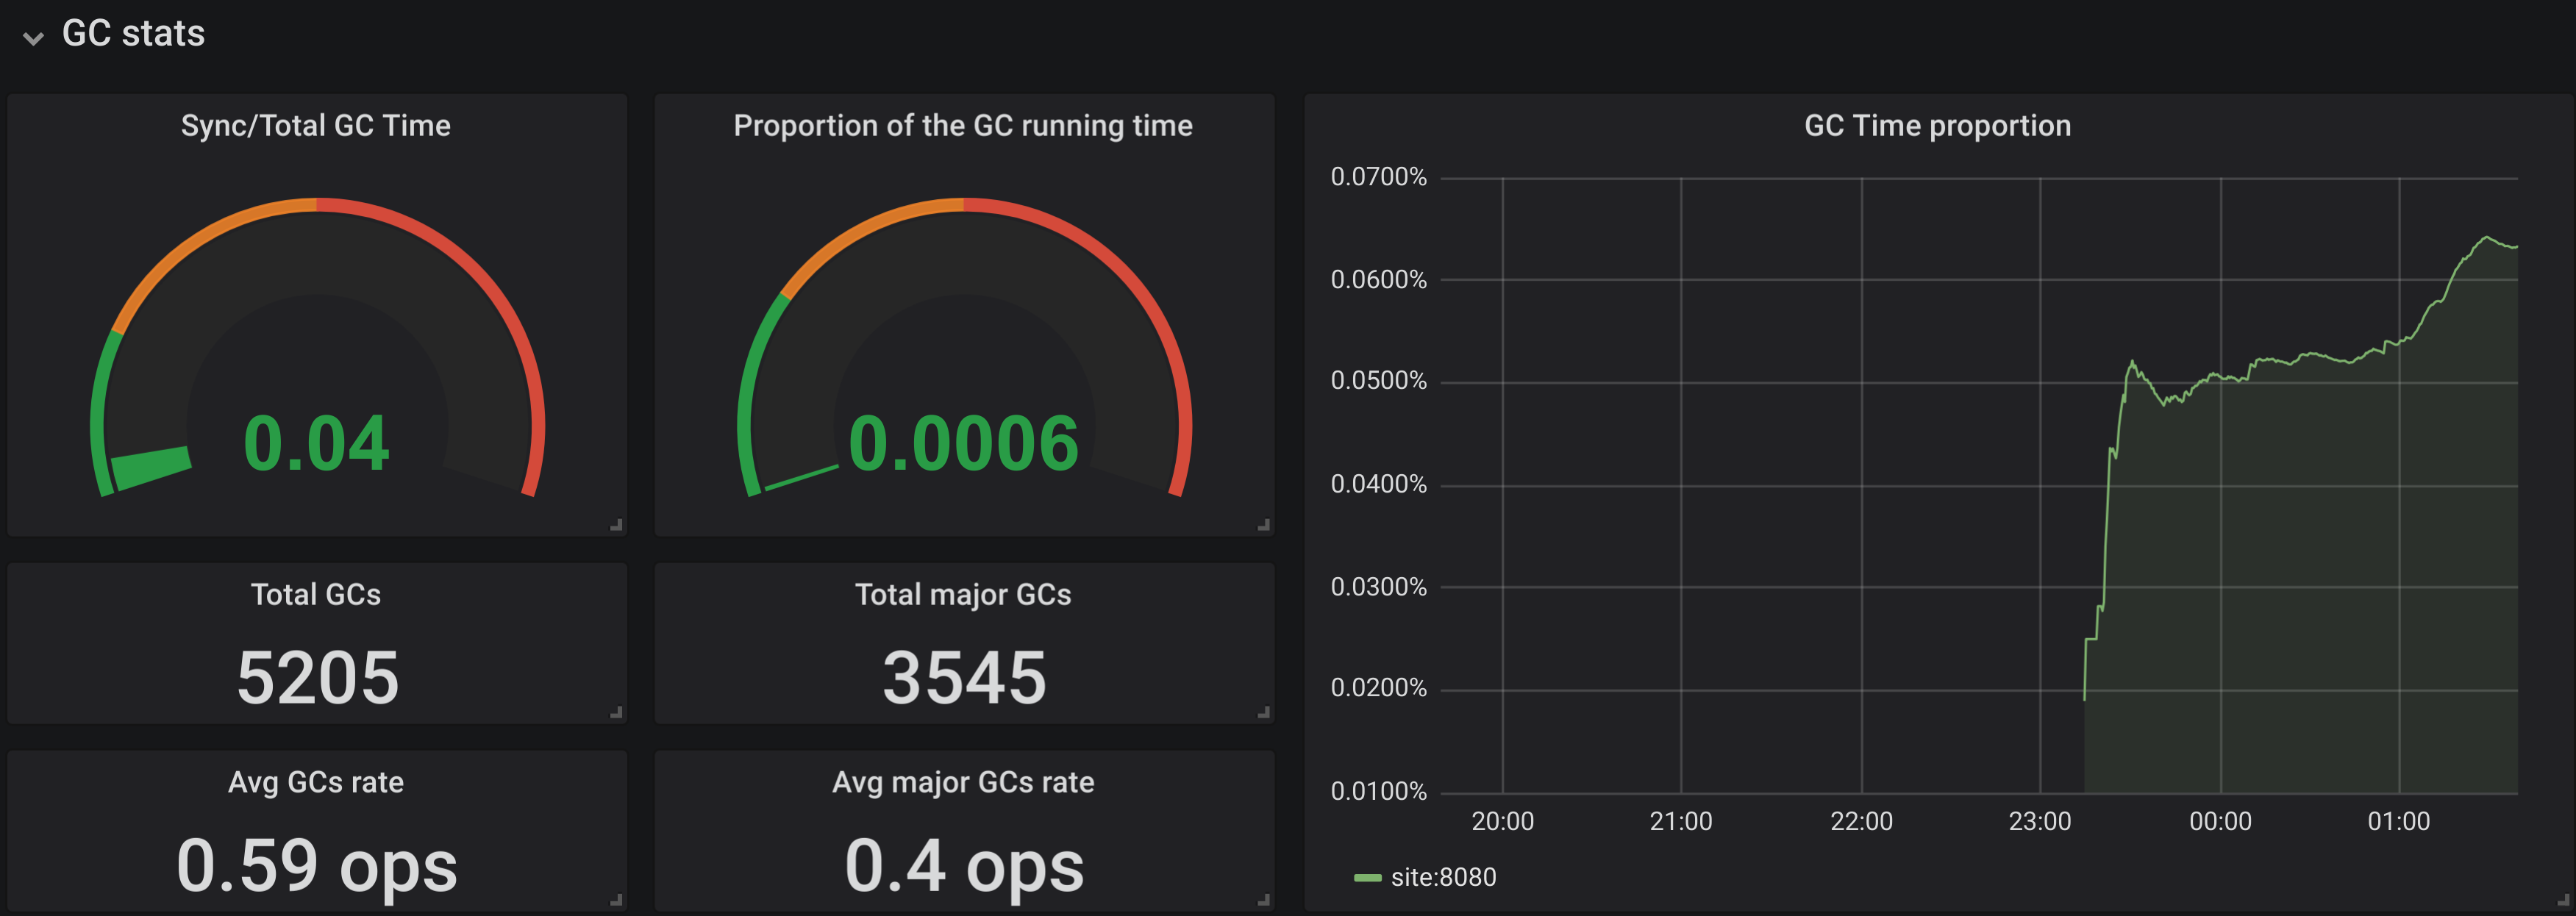
Config itself can be taken from GitHub.
Unfortunately GC information tells us information about the last GC only so everything that had happened between scribe intervals will be missing from our data. In the next post I’m going to run some benchmarks of the application (and potentially introduce other endpoints) and discuss if missing information is actually a problem and what can be done about that.
comments powered by Disqus